
GraphPad Prism is a comprehensive software tool designed for data analysis and graphing.
It offers a user-friendly interface for entering data, performing statistical analyses, and creating high-quality graphs.
Users can access step-by-step tutorials, keyboard shortcuts for efficient navigation, and a range of statistical analyses such as ANOVA, regression, and survival analysis.
GraphPad Prism also allows users to work remotely and collaborate effectively. Additionally, it offers tools for data exploration, checking statistical assumptions, and choosing the right statistical tests based on the type of data and analysis required.
However, there are several alternatives to GraphPad Prism that offer better features and functions. If you want to explore these options, read the article to the end.
Whether you’re working in academia, research, business, or any other field that requires in-depth data exploration, these alternatives can perfectly meet your needs.
Let’s begin.
1. Minitab

Minitab is a cloud-based statistical tool that helps organizations across various industries discover market trends, predict patterns, and visualize data.
Whether you are a small startup or a large enterprise, Minitab provides powerful features and capabilities for your data analysis needs.
With Minitab, you can easily explore and manipulate your data to uncover valuable insights. Its intuitive interface allows you to import, clean, and organize your data with ease.
By leveraging its statistical algorithms, you can perform in-depth market trend analysis and uncover hidden patterns that can drive your business decisions.
One of the key strengths of Minitab is its predictive modeling capabilities. By utilizing advanced statistical techniques, Minitab can help you forecast future market trends and make informed predictions.
Furthermore, Minitab’s data visualization tools enable you to create stunning visual representations of your data. Whether you need to create charts, graphs, or interactive dashboards, Minitab has you covered.
These visualizations provide a clear and concise way to communicate your data insights to stakeholders and make impactful presentations.
Overall, Minitab is a reliable statistical tool that empowers organizations to make data-driven decisions.
Its ability to uncover market trends, predict patterns, and provide data insights makes it an invaluable asset for businesses in today’s competitive landscape.
2. OriginPro

OriginPro is a versatile cloud-based data analysis and graphing solution that is widely utilized by academic institutions, government organizations, non-profits, and businesses.
With its robust features and capabilities, OriginPro offers a comprehensive solution for data analysis and visualization.
One of the standout features of OriginPro is its powerful peak fitting tool. Whether you’re analyzing spectroscopy data, chromatography peaks, or any other type of data with peaks, OriginPro enables you to accurately fit and analyze the peaks to extract valuable insights.
In addition to peak fitting, OriginPro provides a range of tools for surface fitting, which allows you to model and analyze complex data with smooth surfaces and contours.
These tools are particularly useful for researchers in fields such as geology, engineering, and physics.
OriginPro also offers extensive data exploration capabilities, empowering you to navigate through your datasets, uncover trends, and identify patterns with ease.
Its intuitive interface and interactive visualization tools enhance your data analysis experience, enabling you to gain valuable insights quickly.
As a cloud-based solution, OriginPro ensures that your data is secure and accessible from anywhere, anytime. Its collaborative features allow for easy sharing of analyses and reports, fostering collaboration among team members.
Whether you’re a researcher, scientist, engineer, or data analyst, OriginPro provides the necessary tools to unlock the full potential of your data and streamline your analytical workflows.
3. CRM Analytics
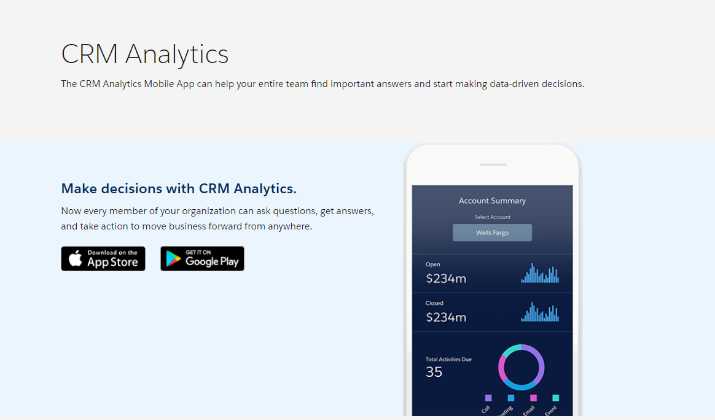
When it comes to business intelligence and data insights, Salesforce Analytics Cloud, also known as Wave Analytics, is a top choice for organizations.
This cloud-based system offers a powerful platform for accessing and sharing business trends and data insights. With Salesforce Analytics Cloud, you can make data-driven decisions, optimize your business strategies, and drive growth.
One key advantage of Salesforce Analytics Cloud is its user-friendly interface, which makes it easy for anyone in your organization to access and analyze data.
Whether you’re a business analyst or an executive, you can quickly gain valuable insights that will help you make informed decisions.
With Salesforce Analytics Cloud, you can easily integrate data from multiple sources, such as customer relationship management (CRM) systems, marketing automation platforms, and other business applications.
This integration enables you to gain a holistic view of your business, uncover hidden opportunities, and identify potential risks.
Another notable feature of Salesforce Analytics Cloud is its advanced analytics capabilities. It leverages artificial intelligence and machine learning algorithms to provide predictive and prescriptive analytics, enabling you to uncover patterns, predict outcomes, and optimize your business processes.
Additionally, Salesforce Analytics Cloud offers robust data security features to ensure the confidentiality and integrity of your data.
You can set role-based access controls, apply data encryption, and monitor data access to protect sensitive information. This level of security is especially important when dealing with valuable business data.
Overall, Salesforce Analytics Cloud is a comprehensive and reliable business intelligence system that provides organizations with the insights they need to drive growth and make informed decisions.
4. Logz.io

Logz.io is a cloud-based log management and log analysis solution that offers organizations a powerful tool for analyzing log data and extracting valuable insights.
Built on the ELK Stack (Elasticsearch, Logstash, Kibana), Logz.io provides advanced log management capabilities combined with machine-learning algorithms to unlock the full potential of your log data.
With Logz.io, you can efficiently centralize and store logs from various sources, making it easier to manage and analyze large volumes of data.
Its robust log analysis features enable you to effectively monitor system health, detect anomalies, and troubleshoot issues quickly.
The machine-learning algorithms integrated into Logz.io can help you identify patterns, predict trends, and gain deeper insights from your log data.
One of the key advantages of Logz.io is its powerful alerting system, which allows you to create custom alerts based on specific log patterns, enabling proactive monitoring and timely response to critical events.
Additionally, Logz.io offers intuitive visualization capabilities, allowing you to create visually appealing charts and graphs to better understand your log data.
Whether you are a small business or a large enterprise, Logz.io’s comprehensive log management and log analysis capabilities make it an ideal choice for organizations looking to gain valuable insights from their log data.
By leveraging Logz.io’s advanced features and machine-learning algorithms, you can improve operational efficiency, enhance security, and make data-driven decisions with confidence
5. Klipfolio
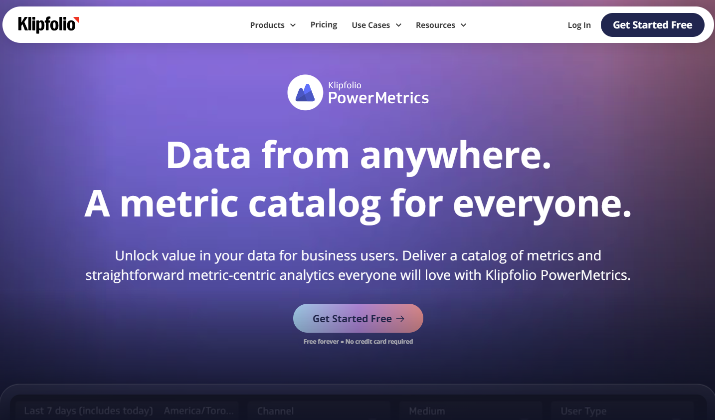
This platform is built with a metric-centric approach, enabling you to gain valuable insights and make data-driven decisions with ease.
Klipfolio offers a range of features designed to simplify your data analysis process. With its data ingestion capabilities, you can effortlessly collect and aggregate data from various sources, allowing you to have a holistic view of your business metrics.
The platform also provides transformation and modeling tools, giving you the flexibility to manipulate and analyze your data in a way that suits your needs.
Whether you’re performing complex calculations or creating customized visualizations, Klipfolio has you covered.
One of the standout features of Klipfolio is its self-serve metrics capabilities. This empowers users to create and customize their own metrics dashboards, giving them access to the specific data they need, when they need it.
With Klipfolio, you can easily monitor key performance indicators and track the success of your business goals.
By using Klipfolio, you’ll have a powerful BI platform at your fingertips, helping you understand and optimize your business performance.
Whether you’re a small startup or a large enterprise, Klipfolio adapts to your needs and provides the insights you need to drive growth and success.
6. Datadog
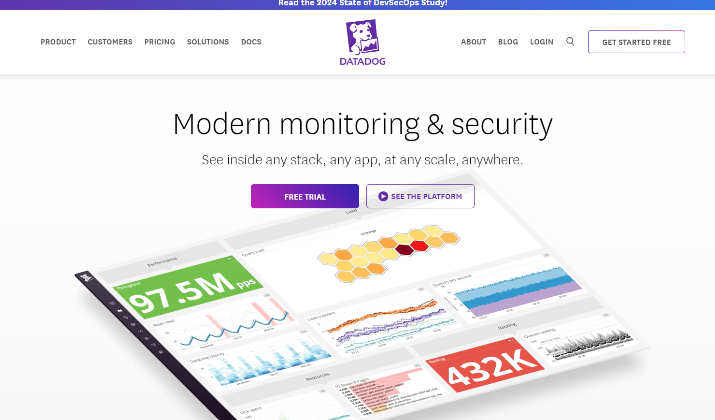
Datadog is a versatile monitoring, security, and analytics platform designed to cater to the needs of developers, IT operations teams, and business users.
With its comprehensive features and capabilities, you can seamlessly integrate and automate infrastructure monitoring, gaining valuable insights and performing in-depth data analysis.
As an all-in-one solution, Datadog empowers organizations to monitor their applications, servers, databases, and networks from a single interface.
You can visualize performance metrics, track logs, and create customizable dashboards to gain real-time visibility into your IT infrastructure.
One of the standout features of Datadog is its robust security framework, which helps organizations identify and mitigate potential threats.
By monitoring and analyzing security logs, you can proactively detect unusual behavior and implement necessary measures to safeguard your systems.
The analytics capabilities of Datadog allow you to extract valuable insights from the collected data. You can apply machine learning algorithms and perform advanced data analysis to identify patterns, trends, and anomalies.
With its user-friendly interface and intuitive navigation, Datadog ensures that both technical and non-technical users can make the most of its features.
Whether you’re a developer, a system administrator, or a business analyst, Datadog provides a unified platform for monitoring, security, and analytics.
7. Phocas Software
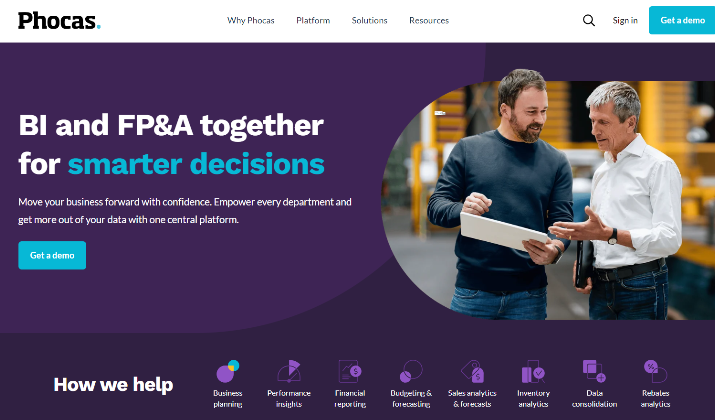
Phocas Software is a versatile data analysis and visualization tool that brings together the most useful data from various systems and presents it in a user-friendly way.
With its intuitive interface and powerful features, Phocas Software is a reliable alternative for businesses seeking easy-to-use data analysis and visualization tools.
One of the standout features of Phocas Software is its robust data visualization capabilities. The platform offers a wide range of visualizations, including charts, graphs, and dashboards, allowing you to explore and present your data in a visually appealing and meaningful way.
Whether you need to create insightful reports for stakeholders or gain valuable insights from complex data sets, Phocas Software’s data visualization capabilities enable you to effectively communicate your findings.
Additionally, Phocas Software provides seamless ERP integration, allowing you to connect and analyze data from your enterprise resource planning (ERP) system with ease.
With Phocas Software, you can also take advantage of other features such as ad-hoc querying, data drilling, and data blending.
These capabilities enable you to delve deeper into your data, uncover hidden patterns and trends, and make data-driven decisions with confidence.
8. Qlik Sense
 Qlik Sense is a versatile business intelligence and visual analytics platform that empowers you to make data-driven decisions.
With its powerful features and user-friendly interface, Qlik Sense allows you to analyze and visualize data in a way that is meaningful and actionable.
One of the key strengths of Qlik Sense is its unique Associative Engine, which enables you to explore data from multiple perspectives and uncover hidden insights.
This powerful engine allows you to make discoveries that might have otherwise gone unnoticed, providing a deeper understanding of your business’s performance.
Qlik Sense offers a wide range of capabilities for data analysis, including data modeling, aggregation, and visualization.
With its intuitive drag-and-drop interface, you can easily create interactive visualizations and dashboards that present information in a compelling and easy-to-understand format.
In addition to its robust data analysis features, Qlik Sense also provides collaborative capabilities, allowing you to share insights and collaborate with your team.
With Qlik Sense, you can transform raw data into valuable insights and gain a competitive edge in today’s data-driven business landscape.
Whether you are a business analyst, data scientist, or executive, Qlik Sense offers the tools and functionalities you need to unlock the full potential of your data.
Conclusion
If you are looking for the best GraphPad Prism alternatives for your data analysis and graphing needs, these are some of the best options available.
Consider your specific requirements and choose the alternative that best suits your data analysis and graphing needs.
The key is to find a solution that provides the features and capabilities your business requires for effective data analysis and graphing.
With these alternatives, you can confidently explore new possibilities and make data-driven decisions for success.