
Splunk is a powerful data analysis and visualization tool used for searching, monitoring, and analyzing machine-generated big data through a web-based interface.
It allows users to create various types of visualizations, including line charts, to represent data trends over time or across different categories.
If you’re the IT lead at a rapidly growing company, tasked with managing an ever-increasing amount of data, you may probably rely on Splunk to analyze logs and monitor your systems.
But as your data scales, so does the cost of maintaining Splunk.
The powerful tool you once thought indispensable is now eating into your budget, and you’re left wondering if there are more affordable or scalable alternatives.
You’re not alone—many organizations reach this crossroads.
Luckily, there are several Splunk alternatives that offer similar, if not more tailored, features to suit your growing needs without the financial strain.
Join us as we uncover the unique features and key benefits of these alternatives, helping you to make an informed decision that aligns with your organization’s goals.
Why Consider Alternatives to Splunk?

Organizations often explore Splunk alternatives for various reasons.
Primarily, the high costs associated with implementing and maintaining Splunk can drive businesses to seek more cost-effective monitoring solutions.
While Splunk is a powerful tool for large-scale data management, smaller companies might not require such expansive capabilities and instead prefer user-friendly platforms.
Many users find the technical requirements of Splunk daunting, particularly those with limited technical expertise. For these individuals, simpler and more intuitive data management tools present a more appealing option.
Additionally, scalability plays a vital role; companies managing smaller datasets may find that Splunk’s complex features exceed their needs.
Furthermore, Splunk sometimes offers an outdated design that may not appeal to newer users.
By considering alternatives, businesses can find platforms that cater better to their operational requirements and provide smoother integration experiences.
10 Best Splunk Alternatives
Here are ten notable alternatives to Splunk, each offering unique features and capabilities for log management and observability:
1. Datadog
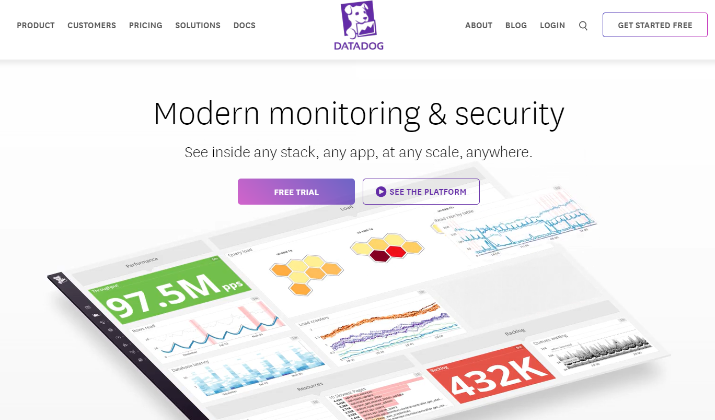
Datadog is a comprehensive monitoring and security platform designed for IT and DevOps teams, providing real-time visibility across an organization’s entire technology stack, including infrastructure, applications, and services.
It enables teams to monitor performance metrics, automate workflows, and enhance collaboration, making it a popular choice for businesses looking to centralize their observability functions.
Some of its key features include:
- Infrastructure Monitoring: Real-time tracking of servers, databases, and cloud services
- Application Performance Monitoring (APM): Insights into application performance and user experience
- Log Management: Automated log collection and analysis for troubleshooting and compliance
- Customizable Dashboards: Visualize data from multiple sources in real time
- Alerts and Notifications: Immediate alerts for critical performance issues via various channels (email, Slack, etc.)
- Integrations: Support for over 250 integrations with popular tools and services
- Incident Management: Tools for tracking and resolving incidents efficiently
- Event Management: Aggregation and correlation of events happening across the infrastructure
- Real User Monitoring: Insights into user interactions with applications
- Workflow Automation: Automate repetitive tasks to improve efficiency
Datadog is better than Splunk due to its more extensive integration capabilities and a unified platform that consolidates various monitoring functions, allowing for easier management and visibility across diverse systems.
2. Loggly
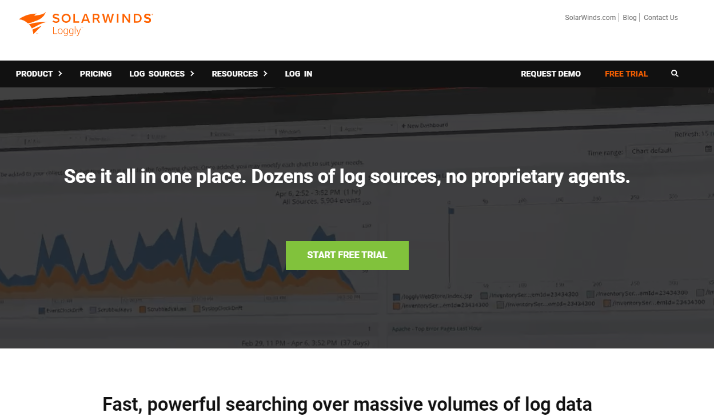
Loggly is a cloud-based log management and analytics platform that helps teams quickly troubleshoot issues, monitor application performance, and gain insights from their log data.
It offers the following features:
- Comprehensive log aggregation from various sources including Linux, Windows, .NET, Java, Scala, Python, PHP, and more
- Powerful search and analytics with automatic parsing and indexing of log data at ingest
- Dynamic field explorer for quickly filtering and visualizing data
- Real-time live tail with filtering and color coding
- Alerting and saved searches to proactively identify problems
- Dashboarding and reporting for monitoring and KPI tracking
- Integrations with popular tools like Slack, GitHub, Jira, PagerDuty, and more
- Scalable SaaS architecture that eliminates the need for additional hardware or software
Due to its lower total cost of ownership (TCO), ease of setup and maintenance, and scalability to handle large volumes of log data without the need for capacity planning, Loggly is a better deal than Splunk.
3. Dynatrace
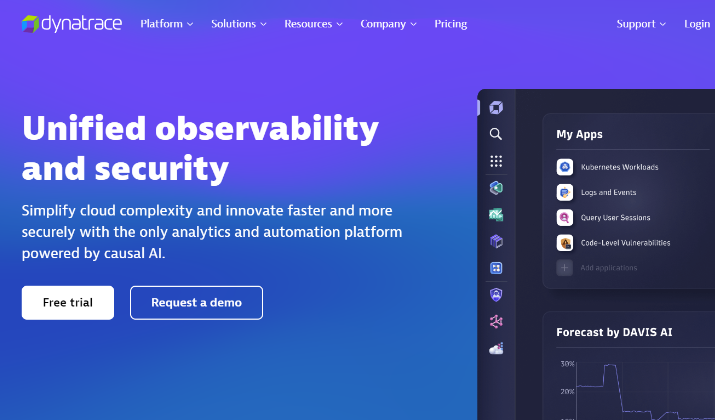
Dynatrace is a comprehensive software intelligence platform that enables organizations to monitor, optimize, and manage the performance of applications, infrastructure, and digital experiences.
Utilizing artificial intelligence, Dynatrace provides real-time insights into complex environments, including cloud-native applications and microservices, facilitating enhanced operational efficiency and user experience.
Here is a look at its features:
- Full-stack Monitoring: Comprehensive observability for applications, microservices, and networks
- Infrastructure Monitoring: Insights into network, container, cloud platforms, and data center technology
- Application Security: Tools for vulnerability analysis and threat protection
- Real-User Monitoring: Captures real user interactions to gather performance insights
- Synthetic Monitoring: Simulates user interactions to evaluate website performance
- Log Management and Analytics: Collects and analyzes log data for troubleshooting and performance monitoring
- Automated Problem Remediation: Uses AI to identify and resolve issues proactively
- Business Analytics: Provides visibility into business KPIs for improved decision-making
- Cloud Automation: Streamlines cloud operations for enhanced efficiency
Dynatrace is often viewed as a more effective option than Splunk for application performance monitoring.
This is because Dynatrace provides integrated observability features specifically designed for complex application environments, while Splunk mainly focuses on log management and analytics.
4. New Relic
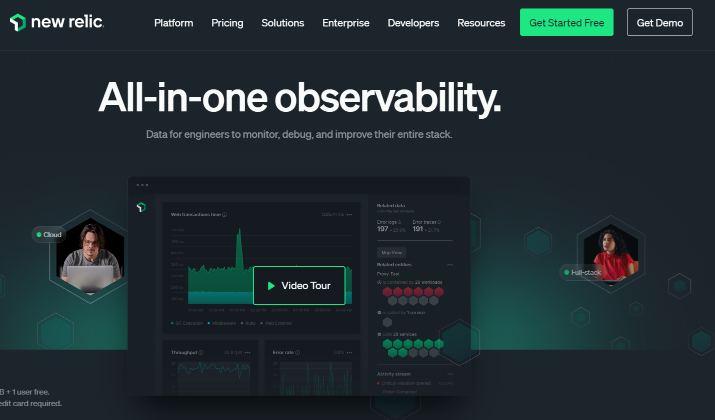
New Relic is a comprehensive observability platform designed to monitor, troubleshoot, and enhance the performance of applications and infrastructure.
It provides a unified data platform that collects and analyzes metrics, events, logs, and traces, enabling organizations to gain deep insights into their systems and improve their digital performance.
It is notable for its powerful features that include:
- Application Performance Monitoring (APM): Monitors applications and microservices to track performance metrics, error rates, and transaction traces
- Browser Monitoring: Analyzes website performance and user behavior by tracking page load times, network requests, and JavaScript errors
- Dashboards: Customizable dashboards that allow users to visualize and arrange data according to their needs
- Alerts: Configurable alerts that notify users of performance issues or anomalies in real-time
- Errors Inbox: A dedicated tool for tracking and resolving errors within the application stack
- Interactive Application Security Testing (IAST): Enhances security by integrating security testing into the application monitoring process
- Logs Management: Collects and analyzes logs to provide context for performance issues and facilitate troubleshooting
- Distributed Tracing: Helps trace requests across various services to identify bottlenecks and optimize performance
New Relic’s focus on application performance monitoring and ease of use allows teams to quickly identify and resolve performance issues without the complexity associated with log management that Splunk emphasizes.
5. Elastic Stack (ELK Stack)
The Elastic Stack, formerly known as the ELK Stack, is a suite of open-source products designed for real-time search, analysis, and visualization of data from various sources.
It primarily consists of four components: Elasticsearch, Logstash, Kibana, and Beats. The stack is widely used for log management, data analytics, and monitoring.
Here are some of its best features:
- Elasticsearch: A distributed, RESTful search and analytics engine capable of handling large volumes of data
- Logstash: A data processing pipeline that ingests data from multiple sources, transforms it, and sends it to a specified destination
- Kibana: A visualization tool that provides a user interface for exploring and visualizing data stored in Elasticsearch
- Beats: Lightweight data shippers that collect and send data from various sources to Logstash or Elasticsearch
- Scalability: Supports horizontal scaling and high availability, allowing for the management of large data volumes
- Real-time Analytics: Enables real-time data processing and analysis for immediate insights
- Security Features: Offers role-based access control, encryption, and audit logging to secure data
- Machine Learning: Includes tools for anomaly detection and predictive analytics
- Integration Capabilities: Supports over 200 pre-built integrations for easy data ingestion from various sources
- Flexible Deployment Options: Can be deployed on-premises or in the cloud (Elastic Cloud)
Elastic Stack is an ideal option for organizations seeking a cost-effective, open-source solution with extensive customization capabilities and no licensing fees.
6. Graylog
Graylog is an open-source log management tool designed for collecting, indexing, and analyzing both structured and unstructured data from various sources.
It serves as a Security Information and Event Management (SIEM) solution, enabling organizations to centralize their log data for enhanced security, compliance, and operational efficiency.
Graylog excels in handling large volumes of data, providing real-time insights into system performance and security with powerful features such as:
- Data Aggregation: Collects and consolidates log data from multiple sources
- Real-Time Event Monitoring: Allows for immediate detection and response to security events
- Search and Filtering: Offers powerful search capabilities with a user-friendly query language
- Custom Dashboards: Users can create and manage dashboards with various visualization widgets
- Alerts and Notifications: Users can set up alerts based on specific log conditions to notify relevant personnel
- Data Enrichment: Enhances log data with additional context for better analysis
- Role-Based Access Control: Manages user permissions and access to log data
- Integration Capabilities: Supports various log formats and protocols, enabling integration with different systems
- Scalability: Can scale horizontally and vertically to accommodate increasing data volumes
- Forensic Analysis: Provides tools for in-depth analysis of security incidents
Compared to Splunk, Graylog is a better option owing to its open-source nature, which allows for greater flexibility and lower total cost of ownership while still providing robust features for log management and analysis.
7. Mezmo
Mezmo is a leading observability platform designed to help organizations efficiently manage and utilize telemetry data.
It provides a comprehensive telemetry pipeline that streamlines data collection, transformation, routing, and analysis, catering to both startups and Fortune 500 companies.
Mezmo is recognized for its ability to enhance productivity and reduce costs associated with data management.
Take a look at some of its highlights:
- Telemetry Pipeline: Collects, transforms, and routes telemetry data for better control and actionability
- Data Utility: Increases the utility of data to help organizations exceed their Service Level Objectives (SLOs)
- Cost Reduction: Filters and consolidates data to eliminate unnecessary information, reducing costs significantly
- Deeper Insights: Provides critical information for informed decision-making
- Accelerated Resolution: Enables faster problem-solving through real-time logging and enriched data context
- Improved Security Posture: Routes important data to Security Information and Event Management (SIEM) systems for enhanced protection
- Data Compliance: Ensures compliance by managing sensitive information appropriately
- Automation: Features automated in-stream alerts to address issues as they arise
- Integration: Compatible with various observability platforms, including Splunk, DataDog, and Prometheus, enhancing existing environments
Mezmo is a good alternative to Splunk due to its focus on cost efficiency and streamlined data management, allowing organizations to optimize their telemetry data without incurring high operational costs.
8. Sumo Logic
A cloud-native platform for log management and analytics, Sumo Logic provides real-time insights and predictive analytics. It is particularly well-suited for organizations looking for a scalable solution.
It provides organizations with real-time insights into their applications and infrastructure, enabling them to monitor, troubleshoot, and secure their operations effectively.
Its key features are as follows:
- Centralized Log Management: Consolidates logs from various sources for easier analysis and troubleshooting
- Real-Time Analytics: Offers immediate insights into system performance and security threats
- Elastic Scalability: Automatically adjusts to handle varying data volumes without requiring hardware management
- Pre-Built Applications: Provides ready-to-use applications for common use cases, simplifying deployment and usage
- Automated Monitoring: Facilitates proactive monitoring of applications and infrastructure to detect issues early
- Machine Learning Capabilities: Utilizes machine learning to identify patterns and anomalies in log data
- Comprehensive Integrations: Integrates with numerous cloud services and platforms for seamless data collection
- User-Friendly Interface: Features intuitive dashboards and search capabilities for easy data exploration and visualization
Considering its fully cloud-based architecture which eliminates the need for complex installations and hardware management, Sumo Logic is a better option than Splunk, providing a more scalable and cost-effective solution for log analytics and monitoring.
9. Sematext
An observability platform that combines log management, monitoring, and alerting. Sematext is known for its ease of use and comprehensive feature set, making it a good alternative for teams needing a straightforward solution.
It is a comprehensive cloud-based monitoring platform designed for full-stack observability, allowing users to monitor application performance, infrastructure health, and log management through a single interface.
It provides insights into real user interactions and synthetic monitoring, making it suitable for various environments, including cloud and on-premises setups.
It comes with powerful features that include:
- Full Stack Monitoring: Supports application, infrastructure, and database monitoring with over 100 integrations
- Real User Monitoring (RUM): Collects performance data directly from users’ browsers to analyze website performance and user satisfaction
- Synthetic Monitoring: Actively monitors APIs and web applications by simulating user interactions from various global locations
- Alerts and Notifications: Offers customizable alerting mechanisms, including anomaly detection and threshold alerts, integrating with tools like Slack and email
- Custom Dashboards: Users can create personalized dashboards with real-time data visualizations and metrics
- Log Management: Centralized log management with features for log analysis, filtering, and alerting.
- Auto Discovery: Automatically detects services and metrics across various environments, simplifying setup and monitoring
- Transaction Tracing: Provides insights into slow database operations and overall transaction performance
- Cost Control: Flexible pricing plans allow users to pay only for what they need without upfront commitments
Additionally, Sematext enables quicker setup and integration across diverse environments without extensive configuration.
10. SigNoz
An open-source alternative that provides observability through metrics, logs, and traces. SigNoz is designed for developers looking for a cost-effective solution with a focus on performance monitoring.
It integrates with OpenTelemetry, allowing for the collection of traces, metrics, and logs, which helps teams diagnose and troubleshoot issues effectively.
Some of its unique features are as follows:
- Unified Observability: Consolidates traces, metrics, and logs in one interface
- OpenTelemetry Support: Compatible with various languages and frameworks through OpenTelemetry instrumentation
- Scalable Architecture: Utilizes ClickHouse for high-performance data storage and querying
- Customizable Dashboards: Users can create dashboards to monitor specific key performance indicators (KPIs)
- Advanced Tracing: Provides detailed visualizations such as flame graphs and Gantt charts for in-depth analysis of request traces
- Real-time Monitoring: Offers live insights into application performance
- Alerting System: Allows users to set up alerts for performance metric breaches
- Distributed Tracing: Tracks requests across different components of a system to identify bottlenecks
- Flamegraphs: Visualizes latency and performance issues in the application stack
- Flexible Deployment Options: Can be self-hosted or used as a cloud service
SigNoz is generally considered a decent alternative to Splunk due to its open-source nature, which eliminates vendor lock-in and offers predictable pricing based on data usage rather than user or host counts.
Conclusion
While Splunk is a powerful tool for log management and analysis, it may not suit every organization’s needs due to its cost and complexity.
Exploring alternatives like SigNoz, Datadog, Graylog, and Loggly can provide more tailored solutions that align with your budget and requirements.
By carefully evaluating these options, you can find a log management solution that enhances your operational efficiency and meets your specific use cases effectively.
A strategic approach to choosing your monitoring solution will empower you to achieve optimal results in your data strategy.