Think of walking into a bustling office where sales reports are piled high on every desk, and team members scramble to keep track of performance metrics.
This scenario is familiar to many professionals striving for insight into their sales data.
Now, envision transforming that chaotic environment into a streamlined haven of information with Power BI dashboards.
With robust data visualization capabilities, these dashboards not only enhance your ability to track sales analytics but also empower your team with the business intelligence tools necessary for strategic decision-making.
In this article, we will explore various examples of Power BI sales dashboards and the key features that make them effective.
Stay with us to learn more.
Introduction to Power BI Dashboards
Power BI dashboards serve as your centralized platform for showcasing key metrics and insights derived from various data sources.
By focusing on dashboard creation, you can simplify complex data into intuitive visualizations, enhancing your data analytics efforts.
Dashboards also provide real-time updates, ensuring that decision-makers have immediate access to critical performance metrics and trends.
As organizations increasingly adopt data-driven strategies, effective dashboards have become indispensable tools. With Power BI’s rich visualizations, you can tailor insights across various business domains, from sales performance to human resources analytics.
Also read: 10 Best Power BI Dashboard Examples
Importance of Sales Dashboards in Business Intelligence
Sales dashboards represent a crucial element in the realm of business intelligence. These tools consolidate key metrics and insights, making it easier for you to monitor sales performance.
- By integrating various data sources, sales dashboards provide a holistic view of performance trends, helping you align your sales strategies with your business objectives.
- Advanced analytics empower your organization to track progress in real-time. This capability enables swift adjustments to strategies, enhancing customer engagement and driving revenue growth.
- Efficient sales tracking allows teams to proactively identify opportunities for improvement and foster better decision-making across the board.
- Dashboards also facilitate collaboration among stakeholders. By sharing data insights, teams can work in sync to address challenges, capitalize on opportunities, and maintain operational efficiency.
- Utilizing sales dashboards not only enhances transparency but also supports a data-driven culture.
As organizations increasingly rely on sophisticated business intelligence tools, the importance of effective sales tracking and performance metrics cannot be overstated.
An informed strategy backed by accurate data lays the foundation for long-term success.
Best Power BI Sales Dashboard Examples
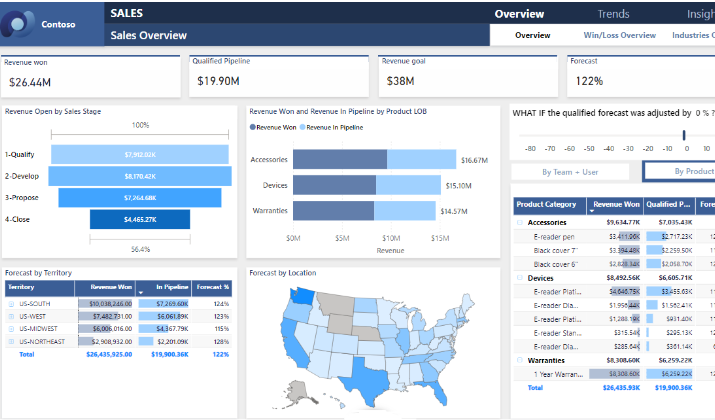
1. Sales Performance Dashboard
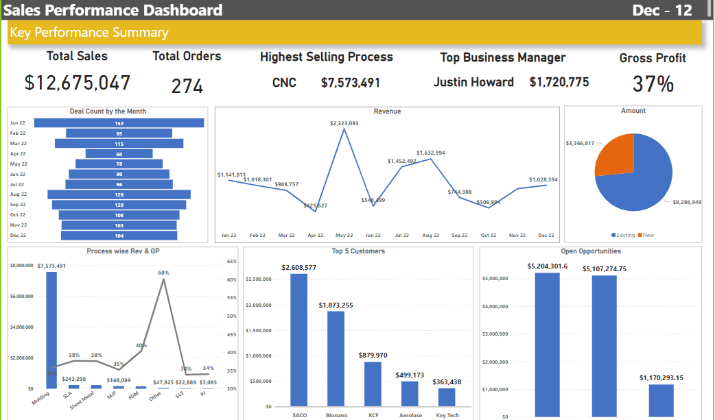
The dashboard is ideal for tracking overall sales revenue, providing a comprehensive view of your financial health.
It highlights key metrics such as total sales, revenue growth, and average deal size, giving you the critical data points needed to assess performance.
The dashboard’s user-friendly design ensures that complex data is presented in a clear and concise manner, making it easy to interpret.
By visualizing trends over time, you can quickly spot emerging patterns and shifts in your sales landscape. This enables you to make informed, data-driven decisions that align with your business goals.
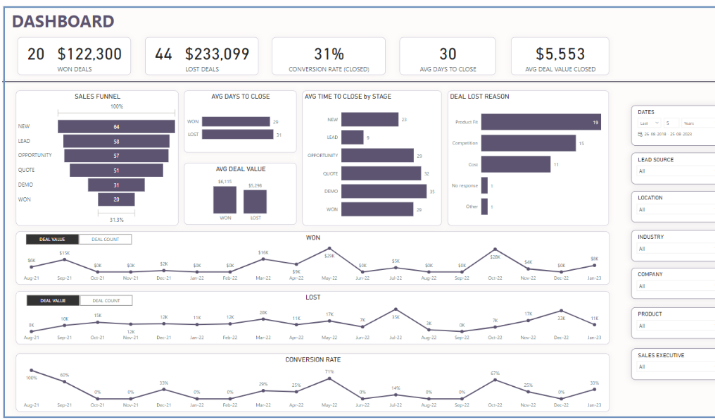
2. Lost Opportunity Dashboard
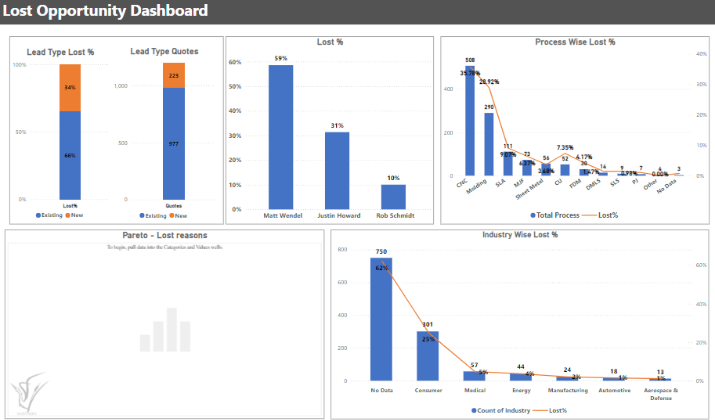
The Lost Opportunity dashboard is essential for understanding where potential sales were missed and why.
It tracks key metrics such as the number of lost deals, the reasons behind each loss, and the stages at which opportunities were dropped.
By visualizing this data, the dashboard provides valuable insights into patterns of lost opportunities, helping you identify recurring issues and areas for improvement.
This allows you to address weaknesses in your sales process and develop strategies to reduce future losses.
Ultimately, the Lost Opportunity dashboard empowers you to refine your approach, turning missed opportunities into valuable learning experiences.
3. Regional Sales Dashboard
The Regional Sales dashboard is a powerful tool for analyzing sales performance across different geographic areas.
It provides detailed insights into key metrics such as sales volume, revenue, and growth rates by region, allowing you to compare the performance of various territories.
The dashboard highlights which regions are thriving and which may need additional support or resources. By visualizing regional trends, you can identify market opportunities and challenges specific to each area.
It equips you with the information needed to tailor your strategies for each region, optimizing your overall sales performance.
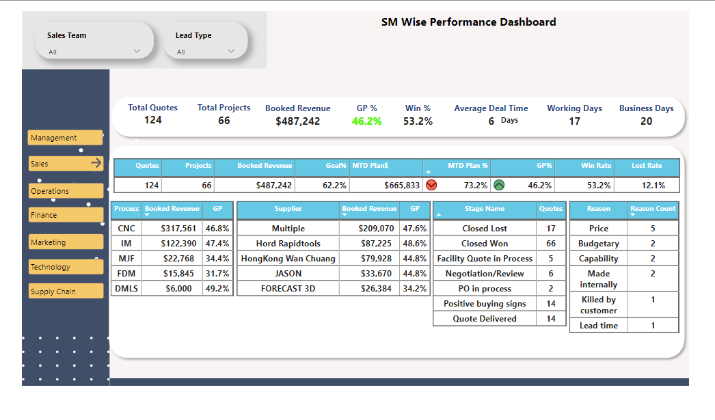
4. Sales Manager Wise Performance Dashboard
5. Sales & Return Dashboard
The Sales and Return dashboard is crucial for understanding the relationship between your sales performance and product returns.
It tracks key metrics such as total sales, return rates, and the financial impact of returns on overall revenue.
By analyzing this data, the dashboard helps you identify products or regions with higher return rates, enabling you to pinpoint potential issues such as quality concerns or mismatched customer expectations.
Visualizing the correlation between sales and returns provides a comprehensive view of your profitability, allowing you to make data-driven decisions to minimize returns and maximize revenue.
6. Store Sales Report Dashboard
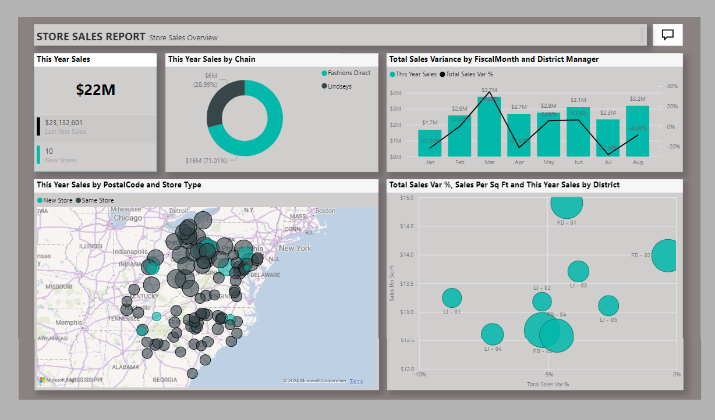
The Store Sales Report dashboard is a vital tool for monitoring the performance of individual retail locations.
It offers detailed insights into key metrics such as daily sales, average transaction value, and foot traffic for each store.
The dashboard allows you to compare the sales performance across multiple locations, helping you identify top-performing stores as well as those that may need additional attention or resources.
By visualizing trends and patterns at the store level, you can make informed decisions on staffing, inventory management, and promotional strategies tailored to each location.
The Store Sales Report dashboard empowers you to optimize the operations of your retail network and drive consistent growth across all your stores.
7. Revenue Opportunities Report Dashboard
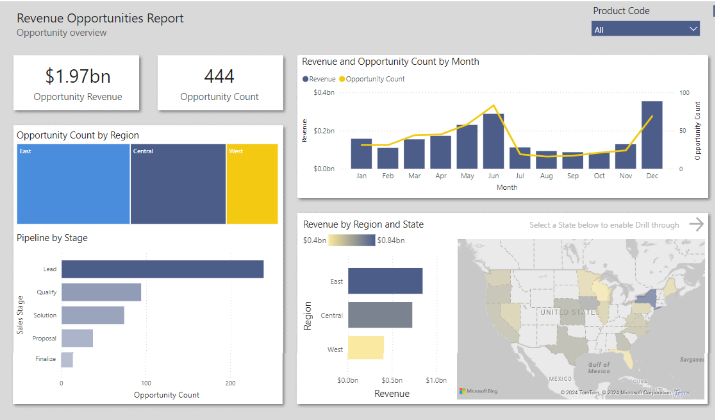
The Revenue Opportunities Report dashboard is a strategic tool for uncovering potential areas of growth within your sales pipeline.
It tracks key metrics such as untapped market segments, cross-selling and upselling opportunities, and potential revenue from existing leads.
By analyzing this data, the dashboard helps you identify where additional revenue can be generated, whether through expanding product offerings or targeting new customer segments.
Visualizing these opportunities allows you to prioritize high-impact initiatives and allocate resources effectively.
It provides a clear roadmap for maximizing your revenue potential, ensuring that no opportunity for growth is overlooked.
8. Global Superstore Analysis Dashboard
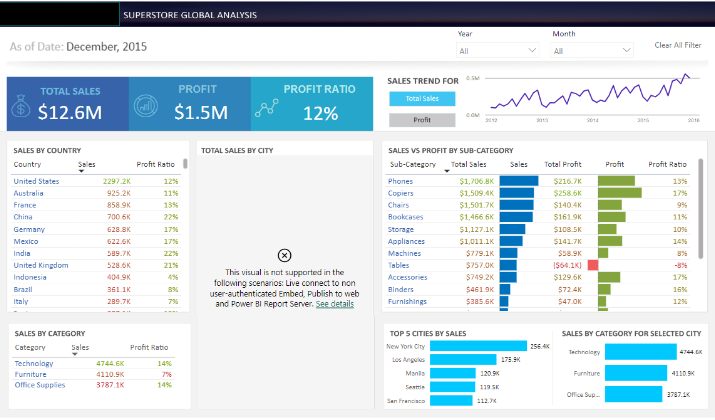
The Global Superstore Analysis dashboard is an essential tool for assessing the performance of a large, multinational retail operation.
It provides a comprehensive view of key metrics such as total sales, profit margins, and inventory levels across different countries and regions.
The dashboard enables you to compare performance globally, highlighting trends and discrepancies between markets.
By visualizing data from various regions in one place, you can identify successful strategies and areas needing improvement on a global scale.
The Global Superstore Analysis dashboard equips you with the insights needed to optimize your international operations, drive profitability, and make strategic decisions to enhance your global retail presence.
9. Brand Awareness Dashboard
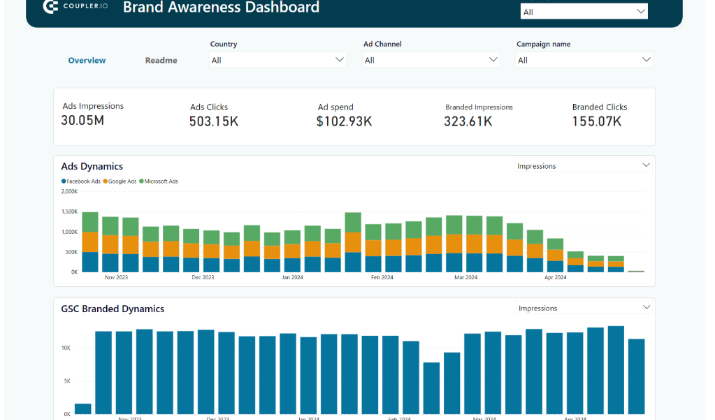
The Brand Awareness dashboard is a crucial tool for measuring and enhancing the visibility of your brand in the market.
It tracks key metrics such as brand mentions, social media engagement, and customer sentiment across various channels.
The dashboard provides a clear view of how your brand is perceived and how effectively it is reaching your target audience.
By analyzing data on brand awareness, you can identify trends in consumer recognition and engagement, allowing you to adjust marketing strategies to boost visibility.
The dashboard helps you make informed decisions to strengthen your brand’s presence and improve overall market impact.
10. Customer Base Dashboard
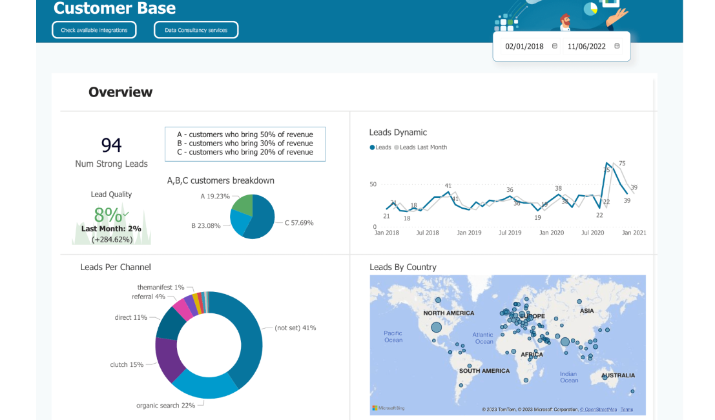
The Customer Base dashboard is a vital tool for gaining insights into the composition and behavior of your customer portfolio.
It tracks key metrics such as customer demographics, purchase frequency, and overall customer retention rates.
The dashboard provides a clear view of who your customers are, how often they engage with your brand, and which segments are most valuable.
Using the dashboard, you can identify trends, segment your customer base more effectively, and tailor your marketing and sales strategies to meet their needs.
It empowers you to enhance customer relationships, improve retention, and drive growth by making data-driven decisions.
11. Ecommerce Store Dashboard
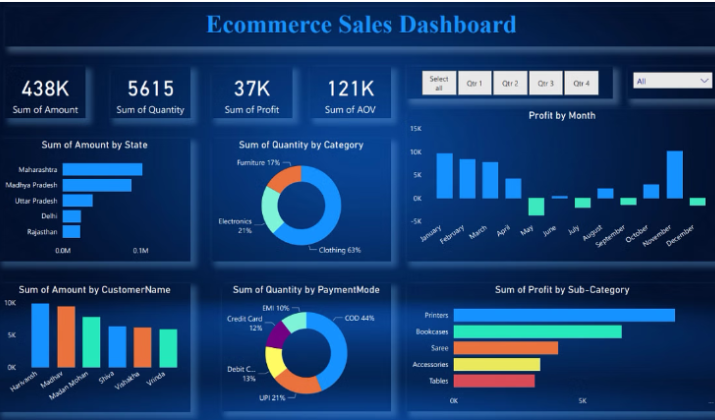
The ecommerce Store dashboard is an essential tool for monitoring the performance and health of your online retail business.
It provides key insights into metrics such as total sales, conversion rates, average order value, and website traffic.
This dashboard allows you to track the effectiveness of your marketing campaigns, identify trends in customer behavior, and evaluate product performance.
Having these metrics in one place, you can quickly assess which aspects of your eCommerce store are thriving and which may need optimization.
The ecommerce store dashboard helps you make data-driven decisions to enhance your online shopping experience, boost sales, and achieve your business goals.
12. Sales Pipeline Dashboard
The Sales Pipeline dashboard is a critical tool for managing and optimizing your sales process. It provides a detailed view of the stages that prospects go through, from initial contact to final deal closure.
Key metrics such as the number of opportunities at each stage, estimated revenue, and average deal size are visualized, helping you track the flow of deals and identify potential bottlenecks.
You can forecast future sales more accurately, allocate resources effectively, and implement strategies to move deals through the pipeline more efficiently.
The Sales Pipeline dashboard empowers you to streamline your sales process, improve conversion rates, and ultimately drive more revenue.
13. Marketing Lead Source Dashboard
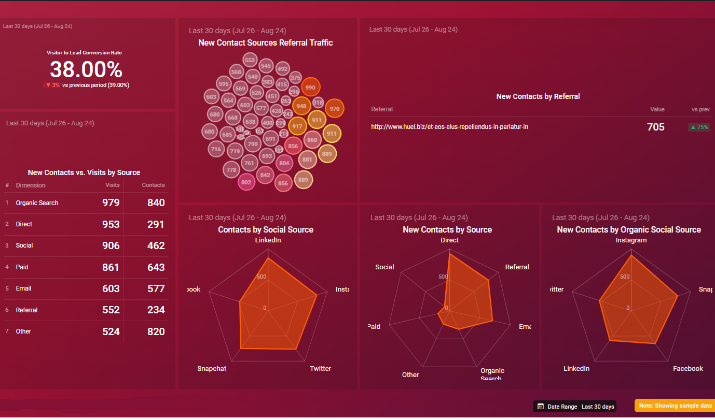
The Marketing Lead Source dashboard is an essential tool for evaluating the effectiveness of your lead generation strategies.
It tracks key metrics such as the number of leads generated from various sources, lead conversion rates, and the overall cost per lead.
By visualizing data on where your leads are coming from—whether through social media, email campaigns, paid advertising, or other channels—the dashboard helps you identify which sources are most effective and which may need adjustment.
Analyzing this data allows you to optimize your marketing efforts, allocate budget more efficiently, and improve lead quality.
The Marketing Lead Source dashboard equips you with the insights needed to enhance your lead-generation strategies and drive better marketing outcomes.
14. Marketing Conversion Pipeline Dashboard
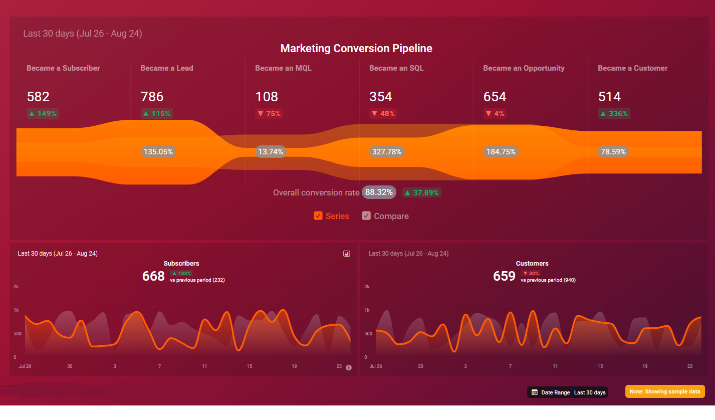
The Marketing Conversion Pipeline dashboard is a crucial tool for tracking and optimizing your lead conversion process.
It provides a detailed view of each stage in the conversion pipeline, from initial contact to final sale.
The key metrics such as conversion rates, lead progression, and time spent in each stage are visualized, helping you identify where leads are dropping off and where improvements can be made.
You can optimize your marketing strategies to enhance lead nurturing, streamline the conversion process, and increase overall conversion rates.
The Marketing Conversion Pipeline dashboard empowers you to make data-driven decisions that enhance the efficiency of your marketing efforts and drive more successful outcomes.
15. Sales vs. Target Dashboard
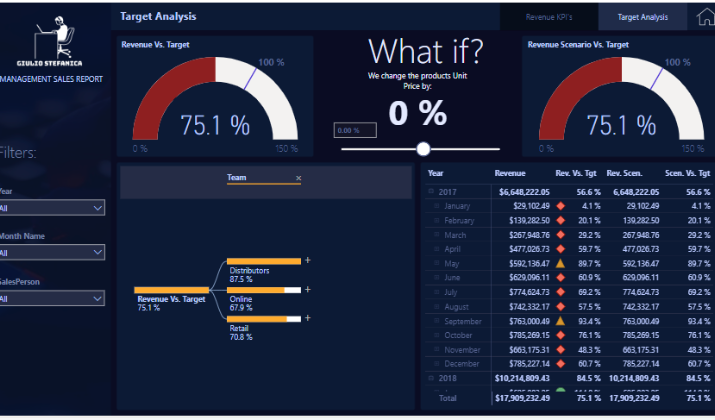
The Sales vs. Target dashboard is an essential tool for tracking your progress toward sales goals.
It visualizes key metrics such as actual sales versus target sales, percentage of goal achievement, and performance trends over time.
This dashboard allows you to quickly assess whether your team is on track to meet or exceed targets, highlighting areas where you may be falling short or surpassing expectations.
With a clear comparison between your current performance and set objectives, you can identify areas needing additional focus or resources.
The Sales vs. Target dashboard empowers you to stay aligned with your sales goals, make timely adjustments, and drive your team toward consistent success.
Conclusion
Power BI sales dashboards are vital tools that enhance business intelligence capabilities.
The effectiveness of dashboards lies in their ability to present key performance indicators (KPIs) and trends, enabling sales managers to refine strategies and better understand target audiences.
Whether analyzing sales figures, monitoring stock levels, or assessing marketing campaign effectiveness, implementing the right sales visualization tools will ensure your business remains competitive and responsive to market changes.